Graphical User Interface (GUI)
Welcome to the GUI. This interface is designed to provide you with a convenient and straightforward user experience. Simply configure your user information and parameters within the GUI, and it will return the results for you. Please see the user manual below for detailed instructions.
Main Component
To run the GUI correctly, you must place the
EasyCOproject folder in the proper directory on your remote server. Then, execute the GUI’s Python scriptrun_gui_test.pyon your local machine (an operating system that can render a graphical interface, typically Windows).
Menu Bar

github: Redirects to theEasyCOGitHub repository.documention: Redirects to theEasyCOdocumentation page for user guides and references.
Server Setup
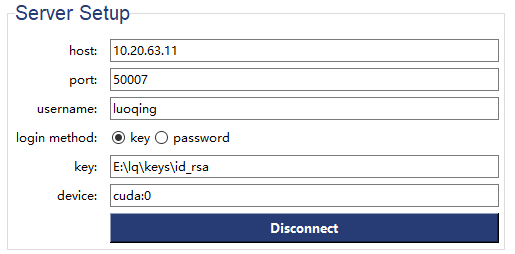
host: The server’s IP address or domain name to connect to.port: The specific port number through which the connection is established.username: The user identity for logging into the server.login method: The authentication method, either key-based or password-based.key: The path to the private key file used for secure login (only if key-based method is chosen).device: The target computation device on the server (e.g., CPU, GPU such as cuda:0).connect: The button to initiate the connection to the server with the provided settings
Problem
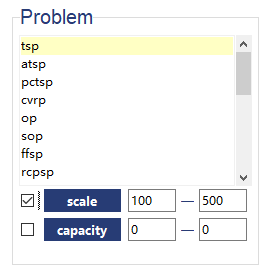
Problem: click the problem you want to solve in theScroll BarFrame.scale: If you tick the box on the left, it means you enable the vary scale function. Enter the range correctly(min-max). In this case, a dataset containing multiple scales will be provided to the solver, and the solver will filter out the instances within the specified range and solve them.capacity: If you check the box on the left, it enables the vary capacity function. Enter the range correctly(min-max). different capacity values will be provided to the solver, and the solver will select the instances satisfiy the specified range and solve them.
Solver
💡Tips: To ensure
Solverare displayed properly, please selectProblemfirst.
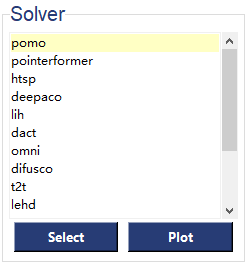
Solver: Click the solver you want to apply for the problem in theScroll BarFrame. Please selectproblembefore you selectsolver.Save: ClickSavebutton to view historical test results. A pop-up will appear where you can select the results you wish to visualize. The system will automatically create a local backup of the log files (located in theGUI/log_temp/directory) for your convenience.
insert picture here: tick the left frame that you want.Plot: ClickPlotbutton to see the visualized results. insert picture here: In theSelect Metricdropdown, you can choose the metric you want to visualize:Score,Augmented Score,Gap, orAugmented Gap. You can also customize the plotting parameters in thePlot Parameterssidebar.
Parameter
💡Tips: Please select
ProblemandSolverfirst to display the correctParameter.
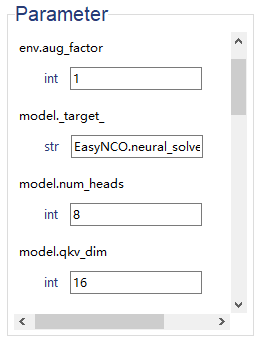
Parameter: Thesettingsfor specificSolverwould be shown in this frame, at least you chooseProblemandSolverproperly. insert picture here: you can modified settings_parameters forSolverdirectly in GUI.
Test Parameter
💡Tips: Please select
ProblemandSolverfirst to display the correctMethodandTask.
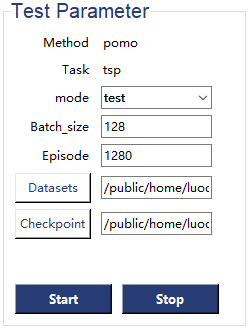
Method: Your selection ofMethodwould be displayed here.Task: Your selection ofTaskwould be displayed here.mode: This is a dropdown menu to select the mode. The options areTestandTraining, withTestbeing the default setting.Batch_size: The number of instances in a batch.Episode: The total number instances in an epsiode.Decoder_Strategy: The Decoder Strategy, which includes Greedy Search and Sampling, determines how the next token is selected from the decoder’s output probability distribution to construct the final sequence, balancing between precision and diversity.Datasets: Click theDatasetbutton, select a file in the pop-up window, and the file’s location will be displayed in the entry field. When conducting avary-scaletest, you can select an entire folder instead of a single file.Checkpoint: Click theCheckpointbutton, select a file in the pop-up window, and the file’s location will be displayed in the entry field.Start: Click theStartbutton to start the process.Stop: Click theStopbutton to stop the process. > 💡Tips: Please clickStopbutton to terminate the lastStartand reset settings before initiating the nextStart.Epoch(only for training): The number of epoch for training process.Curve(only for training): Click theCheckpointbutton, you can trace training process in visualized results. There are three options available in the drop-down box:loss score,scoreandeval_score.
Log File Output
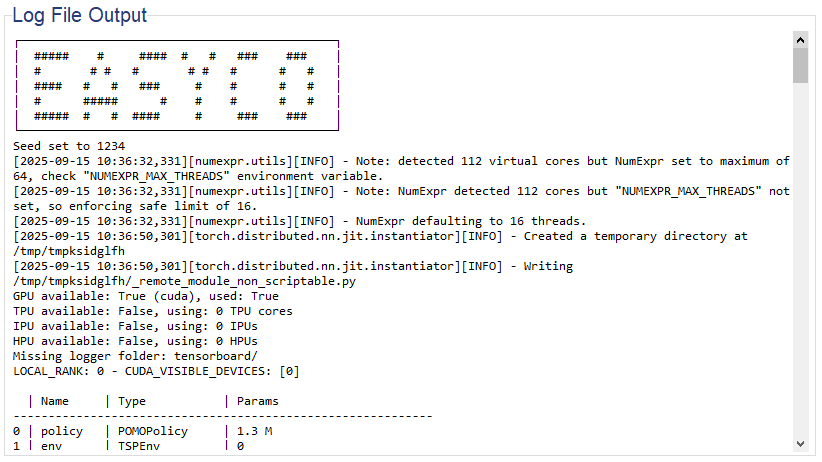
During the Test and Training processes, the terminal logs will be synchronously updated in the “Log File Output” area, facilitating process tracking.
Summary Output
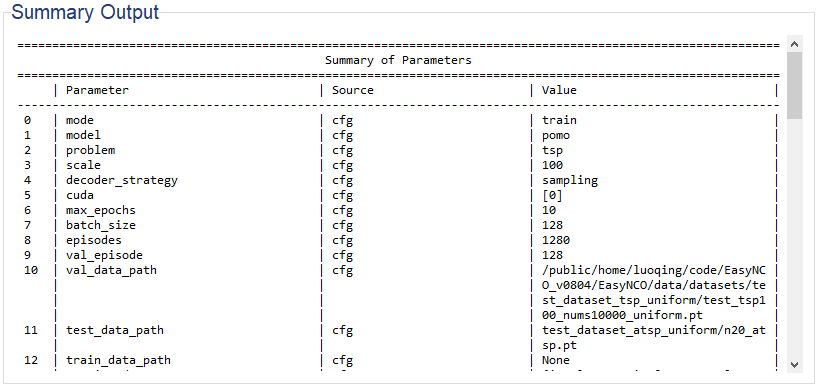
💡Tips: Detailed parameter information will be displayed in the
Summary Outputsection, where you can verify whether your parameters are set correctly.
| Source | Description |
|---|---|
cfg |
You can refer to the parameter in configs.yaml. |
settings |
You can refer to the parameter in xxx_settins.yaml. |
Instructions for Quick Start

Connect the remote Server first. When a successful connection to the remote server is established, you can view the prompt message in the
Log File Outputsection.Choose the
Problemyou want to solve inProblemsection. tick the box when you want selectvary-scaleorvary-capacityfunction. (💡 left: min value, right: max value)Choose the
Solveryou want to apply inSolversection.You can customize parameter settings in the “Parameter” section; alternatively, you can leave the default settings intact without making any adjustments.
modify
Test ParameterorTraining Parametercarefully. make sure the location ofdatasetsandcheckpointis correct.click
startbutton to start process.click
stopprocess to terminate process.